



Week of October 12, 2026
Published every Monday: Get a detailed snapshot of what moved the markets last week—and what to watch this week.
Earnings take center stage as markets seek broader participation.
Large-cap U.S. stocks moved higher last week as Treasury yields backed off 25-year highs. Some beaten-down sectors led the way, providing a modest improvement in market breadth. The pullback in the 10-year Treasury yield, which closed at 5.25 percent, allowed fixed income markets to rally.
Weekly Quick Hits
BEYOND THE HEADLINES:
Earnings take center stage as markets seek broader participation.
Despite Treasury yields surging to levels not seen in almost 25 years, the S&P 500 and the Nasdaq Composite set all-time highs on Tuesday and closed the week not far from those levels. The indices mask some of the underlying moves across the broader market, however. A handful of the largest growth companies have once again driven market returns. Under the surface, more than half of the stocks in the S&P 500 have declined 20 percent from their all-time highs. Before posting a gain last week, the equal-weight S&P 500, which removes the impact of company size from the index weighting, had declined for seven consecutive weeks.
Interest rate–sensitive parts of the market such as financials and yield-oriented sectors such as utilities and real estate have come under the most pressure. While earnings season is always an important time for investors, upcoming third-quarter reports are likely to carry more weight as investors gauge whether there will be a rotation into the 490 other stocks in the index or whether the market will remain top-heavy.
Another Strong Quarter Expected
According to FactSet, the expected growth rate for third-quarter earnings is 29.9 percent. That would mark three consecutive quarters of earnings growth exceeding 25 percent. Expectations have increased since the end of June, when analysts anticipated 26.7 percent growth. Based on recent history, analyst expectations have proven conservative, and earnings have ultimately come in higher than expected once reporting season gets underway.
On the flip side, as the bar gets raised, it becomes harder to clear. This increases the possibility of disappointment. That’s why this reporting season takes on a brighter spotlight for investors.
Across-the-Board Earnings Growth Is Key
Given the dichotomy in market performance, where earnings growth comes from will be important in terms of whether the recent rally can broaden and whether market breadth can improve. Broader market participation was critical to the market’s performance earlier this year.
According to FactSet, all 11 sectors are expected to deliver earnings growth, with five anticipated to deliver double-digit earnings growth. Even after the so-called Magnificent Seven stocks are removed from third-quarter earnings expectations, the rest of the market is still expected to deliver earnings growth of more than 20 percent.
We’ve Been Here Before
Earnings growth has been the linchpin to market performance over the past few years. Despite the headwinds facing the U.S. economy because of tariffs and inflationary pressures, corporate America has managed to deliver earnings growth above expectations. If this trend continues over the next few weeks, it should bode well for equity markets and broadly diversified portfolios. But results and commentary from executive teams warrant monitoring for any signs of caution.
“Even after the so-called Magnificent Seven stocks are removed from the third-quarter earnings expectations, the rest of the market is still expected to deliver earnings growth of more than 20 percent.”
Report Releases: October 5–9, 2026
Institute for Supply Management (ISM) Services Index:
September (Monday)
Service sector confidence fell more than expected last month in part because of a slowdown in new order growth. Despite the decline, the index remains in healthy expansionary territory.
- Expected/prior month ISM Services index: 55.0/55.4
- Actual ISM Services index: 54.9
Federal Open Market Committee (FOMC) Meeting Minutes:
September (Wednesday)
Minutes from last month’s FOMC meeting showed signs of a united central bank, with all 19 participants agreeing that higher interest rates were appropriate to combat inflation. The minutes also showed that most FOMC participants favored at least one more rate hike this year.
Preliminary University of Michigan Consumer Sentiment Survey:
October (Friday)
Consumer sentiment fell further than expected, bringing the index to a five-month low. Souring consumer views on current economic conditions were the primary driver.
- Expected/prior month consumer sentiment: 47.6/48.1
- Actual consumer sentiment: 46.3
The Takeaway
- Economic data was mixed; service sector confidence remained well in expansionary territory, but consumer confidence dipped to a five-month low.
- Minutes from last month’s FOMC meeting showed a unanimous decision to raise rates, with most members favoring another increase this year.
Financial Market Data
Equity
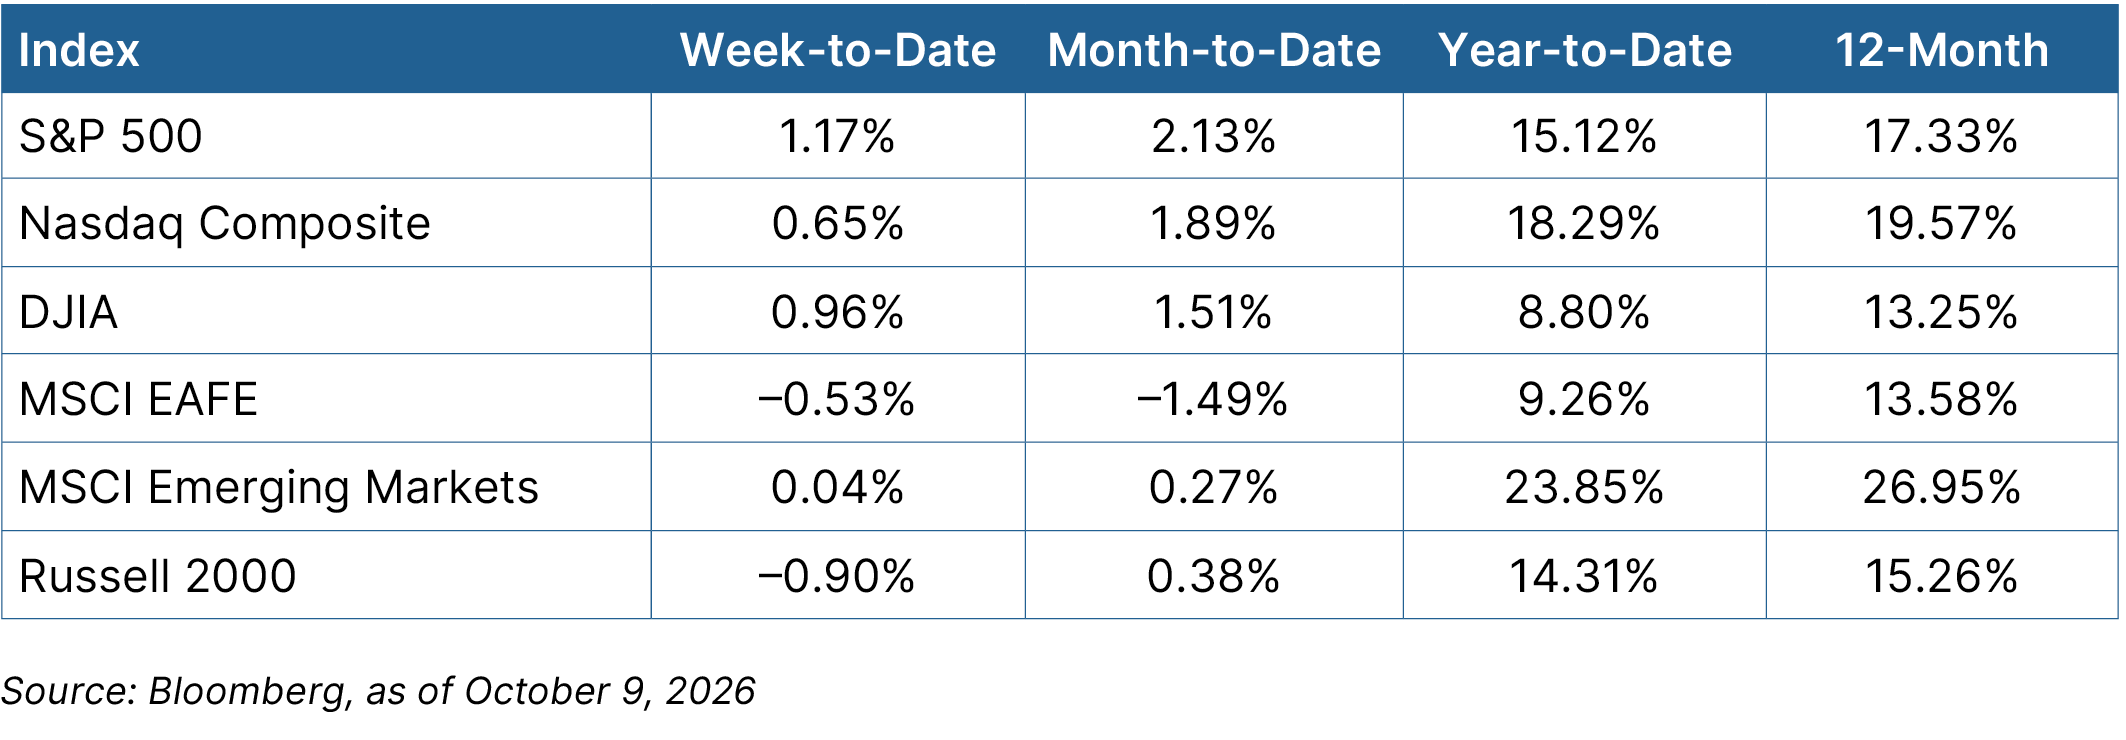
Large-cap U.S. stocks closed higher across the board. The S&P 500 was the best-performing index, rallying 1.17 percent. The Dow Jones Industrial Average rose nearly 1 percent, and the Nasdaq Composite closed more than 0.5 percent higher. The Russell 2000 declined for the fifth consecutive week. Breadth improved, with the consumer staples, utilities, energy, and consumer discretionary sectors each rising more than 3 percent. Only industrials and technology finished the week in negative territory. International markets were mixed, with developed markets down slightly and emerging markets up marginally.
Fixed Income
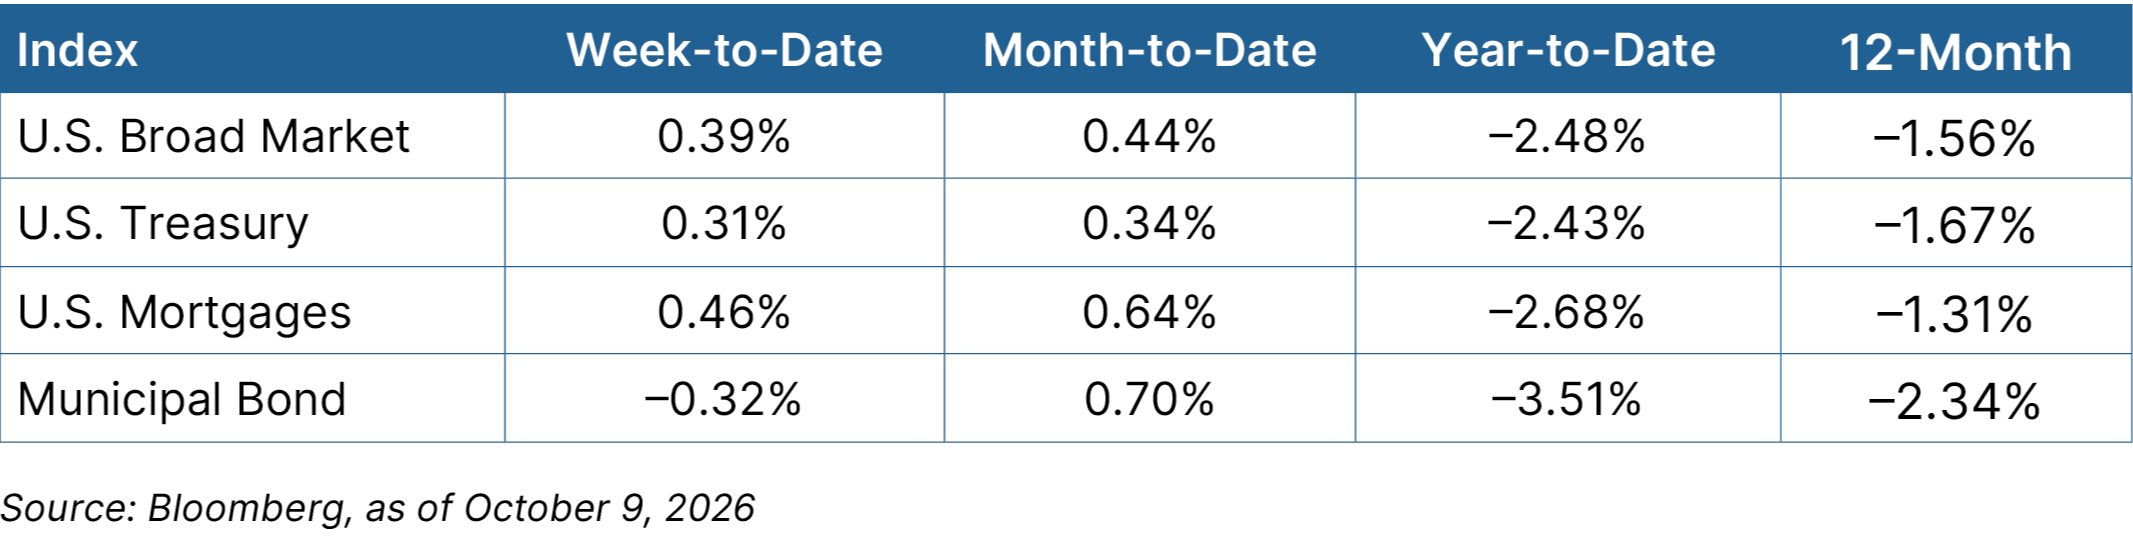
The 10-year Treasury yield hit a 25-year high early in the week, but strong auction demand later in the week for the 10-year and 30-year relieved some pressure on yields. Treasuries were firmer across the yield curve, with the 10-year closing at 5.25 percent, down 3 basis points (bps) from the previous week. Fixed income markets found their footing and closed higher. Core bonds, Treasuries, and mortgages moved higher, while the municipal market recorded a small loss.
The Takeaway
- Paced by the S&P 500, large-cap U.S. stocks were higher. Breadth returned, with recently pressured sectors among the best performers.
- Treasury yields pulled back from 25-year highs, and bond markets rallied marginally.
Looking Ahead
Data this week will focus on inflation, with economists and investors anticipating updates on consumer and producer inflation. Both measures are expected to accelerate, given the still-elevated crude oil prices that are working their way through the system.
- The week kicks off on Tuesday with an update on existing home sales for September. It’s anticipated that the pace of sales will slow because of high prices and rising mortgage rates
- On Wednesday, we’ll see the Consumer Price Index (CPI) for September. Consumer inflation is expected to rise to 3.6 percent.
- Finally, on Thursday, we’ll see the Producer Price Index (PPI) for September. Producer prices are expected to rise at a slightly faster rate than they did in August.
Disclosure: This material is intended for informational/educational purposes only and should not be construed as investment advice, a solicitation, or a recommendation to buy or sell any security or investment product. Diversification does not assure a profit or protect against loss in declining markets, and diversification cannot guarantee that any objective or goal will be achieved. Please contact your financial professional for more information specific to your situation.
Bonds are subject to availability and market conditions; some have call features that may affect income. Bond prices and yields are inversely related: when the price goes up, the yield goes down, and vice versa. Market risk is a consideration if sold or redeemed prior to maturity.
Certain sections of this commentary contain forward-looking statements that are based on our reasonable expectations, estimates, projections, and assumptions. Forward-looking statements are not guarantees of future performance and involve certain risks and uncertainties, which are difficult to predict. All indices are unmanaged and are not available for direct investment by the public. Past performance is not indicative of future results. The S&P 500 is based on the average performance of the 500 industrial stocks monitored by Standard & Poor’s. The Nasdaq Composite Index measures the performance of all issues listed in the Nasdaq Stock Market, except for rights, warrants, units, and convertible debentures. The Dow Jones Industrial Average is computed by summing the prices of the stocks of 30 large companies and then dividing that total by an adjusted value, one which has been adjusted over the years to account for the effects of stock splits on the prices of the 30 companies. Dividends are reinvested to reflect the actual performance of the underlying securities. The MSCI EAFE Index is a float-adjusted market capitalization index designed to measure developed market equity performance, excluding the U.S. and Canada. The MSCI Emerging Markets Index is a market capitalization-weighted index composed of companies representative of the market structure of 26 emerging market countries in Europe, Latin America, and the Pacific Basin. The Russell 2000® Index measures the performance of the 2,000 smallest companies in the Russell 3000® Index. The Bloomberg US Aggregate Bond Index is an unmanaged market value-weighted performance benchmark for investment-grade fixed-rate debt issues, including government, corporate, asset-backed, and mortgage-backed securities with maturities of at least one year. The U.S. Treasury Index is based on the auctions of U.S. Treasury bills, or on the U.S. Treasury’s daily yield curve. The Bloomberg US Mortgage Backed Securities (MBS) Index is an unmanaged market value-weighted index of 15- and 30-year fixed-rate securities backed by mortgage pools of the Government National Mortgage Association (GNMA), Federal National Mortgage Association (Fannie Mae), and the Federal Home Loan Mortgage Corporation (FHLMC), and balloon mortgages with fixed-rate coupons. The Bloomberg US Municipal Index includes investment-grade, tax-exempt, and fixed-rate bonds with long-term maturities (greater than 2 years) selected from issues larger than $50 million. One basis point is equal to 1/100th of 1 percent, or 0.01 percent.
Authored by the Investment Research team at Commonwealth Financial Network®.
© 2026 Commonwealth Financial Network®
Let’s Talk About Your Financial Future
Whether you’re navigating a volatile market or preparing for the future, we’re here to help.